
Looker Studio aggregations got you down? You are not alone.
While Looker Studio is a great free tool for data visualization, it is not without its limitations. While working with a client recently, we noticed that the user data from Google Analytics would aggregate differently depending on the time dimension used for display. This posed an important issue since this client specifically wanted the ability to change the time dimension interval from Day to Week to Month.
At this point, we used the default drill-down based on date to display our results. For those who are not familiar, this is created by adding the Date dimension and selecting the drill down toggle.
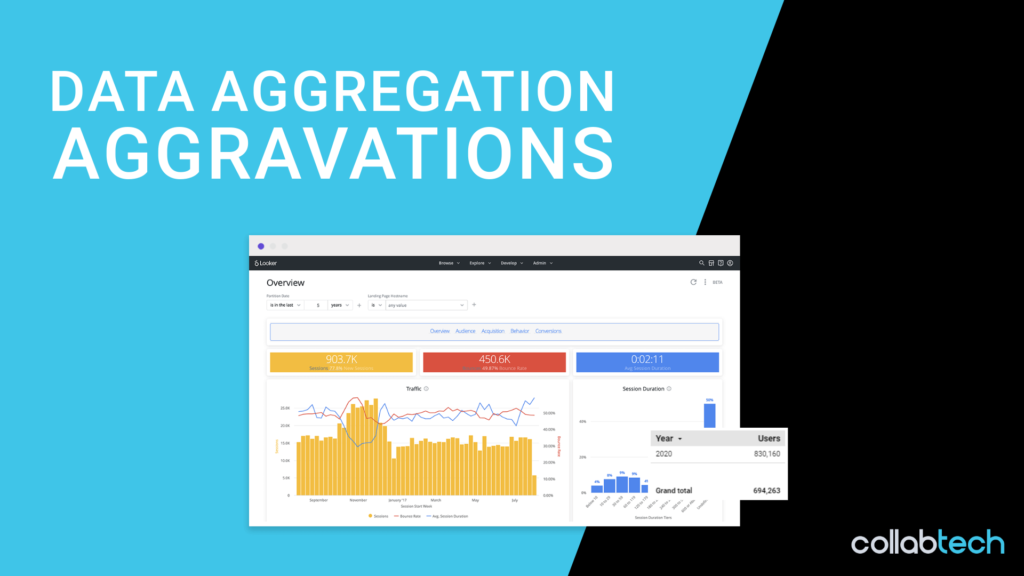
While this looks like a nice easy solution, it created a bunch of aggregation issues when we looked at the user data. When each line of this table was summed by hand, we realized that the totals did not match the Grand Total that Looker Studio was summarizing for us. The most obvious of these examples was the Year summary (pictured below). With only one year of data in this table, it is apparent that something isn\’t adding up (pardon the pun).

To make the issue even more confusing we noticed that this wasn\’t affecting our Event or Pageview information. After some time spent investigating the issue, it appeared that the problem was only seen when looking at unique data across multiple days, such as users or unique pageviews. This was the big tip-off. It showed that the individual lines in our table were based on summing up each day of data within the given interval. So a week of user data would show as day 1 + day 2 + … + day 7. However, the Grand Totals Looker Studio provided were based on a separate API request from Google Analytics, which is why they showed the correct total users for the entire time frame. This is because the User metric is based on unique users. So Jane Smith visiting on Monday and Thursday should count as one user for each day, but as only one user total for the week.
Now that we know the issue, how do we resolve it? The solution was surprisingly simple! After trying some very complicated solutions that were found in various online forums that involved creating separate API requests into Google Sheets and then connecting that information into Looker Studio, we found this could be resolved by just changing the drill down parameters to separate time interval dimension (already built-in!) rather than different visualizations of the “Date” dimension.

This allowed our client to see accurate user data for each line item and the overall period as well! While you may still see a discrepancy in the sum of all the line items and the given Grand Total, they are both accurate because each line is a separate data point directly from Google Analytics rather than a summed result in Looker Studio. For clarity: The discrepancy is due to individual users showing up in multiple line items but only being counted once in the Grand Total.
Hopefully, this solution can save you some time and frustration. Good Luck!